
By Ebbe Barsøe Nielsen, Emil Cramer Monk, Jonathan Vinther Højgaard and Prof. Kristjan Jespersen
For years, biodiversity has been called the next frontier of sustainable finance. That frontier is no longer distant. Policymakers, investors, and companies increasingly recognise that nature loss is not just an ecological emergency; it is a material financial risk. Freshwater availability, soil health, stable agricultural supply chains, and functioning ecosystems underpin large parts of the real economy. As a result, biodiversity has moved rapidly from the margins of ESG into the regulatory core, driven by the Corporate Sustainability Reporting Directive (CSRD), European Sustainability Reporting Standard E4 (ESRS E4), and the Taskforce on Nature-related Financial Disclosures (TNFD).
And yet, for all this momentum, biodiversity remains genuinely difficult to integrate into investment analysis. Unlike climate change (where carbon emissions provide a single, globally comparable metric), biodiversity is multidimensional, deeply local, and non-linear. It spans water use, land conversion, pollution, ecosystem degradation, and supply-chain exposure, varying sharply across industries and geographies. No single number captures it.
This creates a structural challenge for markets. ESG scores increasingly incorporate biodiversity-related indicators, yet often reward disclosure maturity rather than real-world ecological pressure or genuine preparedness. Biodiversity is important, yet still poorly understood in practice.
The biodiversity data problem is worse than you think
The core challenge is not simply that biodiversity data are scarce. It is that the data which do exist are fragmented, inconsistent, and easy to misread. Most biodiversity-relevant information is scattered across heterogeneous ESG indicators that differ in scale, meaning, and materiality. Governance commitments, intensity metrics, recycling rates, and controversy events are fundamentally different kinds of signal, yet they are routinely treated as interchangeable inputs and aggregated into a single composite score. This flattens complexity and masks the trade-offs that matter most for investors.
Disclosure bias compounds the problem. Firms with limited direct ecosystem exposure often score well simply because fewer biodiversity indicators are material to their business models. Conversely, companies in agriculture, mining, or manufacturing may score poorly even when actively managing biodiversity risks, because their core activities generate unavoidable environmental pressure. Missing data create a further trap: mechanically penalising non-disclosure conflates reporting gaps with weak performance, while ignoring missing values risks overstating the preparedness of firms that simply disclose less.
Finally, biodiversity risk is inherently place-based. Ecosystem impacts occur locally: at the watershed, the forest edge, the coral reef. Corporate reporting is almost always aggregated at the firm or group level. Translating site-specific ecological realities into comparable firm-level signals is an unsolved challenge that no index has yet resolved. Together, these issues explain why biodiversity has struggled to gain analytical clarity within ESG frameworks, despite its growing regulatory prominence.
Our goal, therefore, is not to perfectly measure biodiversity impact (no tool can do that today). It is to construct a credible, scalable methodology that helps investors distinguish between firms that are better or worse prepared for the risks of a nature-constrained economy.
Introducing the BNPi: building a better signal
To address this gap, we developed the Biodiversity and Nature Performance Index (BNPi): a structured framework that translates fragmented ESG data into an interpretable, actionable biodiversity performance signal. The BNPi does not ask whether companies are “nature-positive”. That question, while important, cannot yet be answered reliably at scale. Instead, it assesses relative preparedness, governance quality, and environmental pressure, given current disclosure constraints.
The methodology begins with indicator selection. From more than 870 ESG data fields in LSEG Workspace, we identified 36 quantitative indicators with direct relevance to biodiversity and nature. These capture both biophysical pressure: water use intensity, waste generation, and pollutant levels, as well as organisational readiness: biodiversity commitments, risk assessments, targets, and supply-chain due-diligence processes. Indicator selection follows the logic embedded in ESRS E3/E4 and TNFD.
Next, indicators are harmonised. Because biodiversity data come in incompatible formats, all indicators are mapped onto a common 0 to 100 scale. Intensity metrics are inverted so that lower pressure corresponds to higher scores, while binary indicators reflect the presence or absence of governance structures. Crucially, firms are not penalised for missing data; indicators contribute to the index only when data are available, supported by a separate coverage ratio1 to maintain transparency about how much of a firm’s result is grounded in actual disclosure versus assumed defaults.
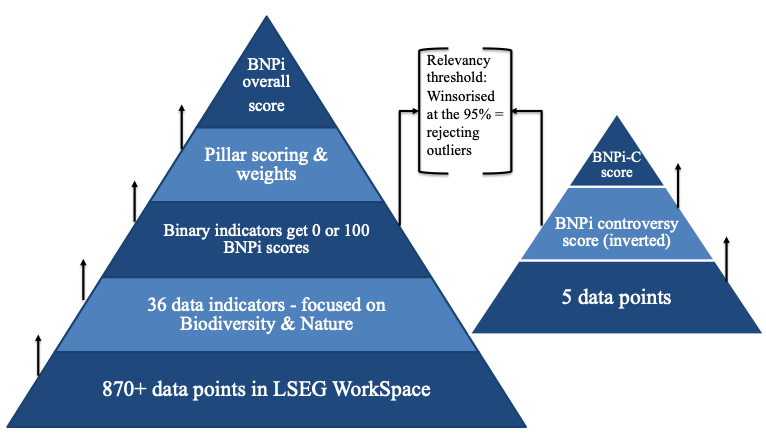
Figure 1: Illustration of how ESG indicators are transformed into an overall index. Source: own creation.
The final step and the core analytical contribution is structure. Rather than relying on a single aggregate score, the BNPi is deliberately designed as a five-pillar framework, reflecting the fact that biodiversity performance is not one-dimensional.
The Governance and Policy pillar captures organisational readiness: does the firm have the institutional capacity to identify and manage biodiversity-related risks through formal commitments, risk assessments, and supplier oversight? The Targets and Actions pillar evaluates forward-looking intent, examining whether governance structures are actually translated into measurable, time-bound objectives addressing biodiversity and environmental pressure.
The Pressure and Intensity pillar reflects firms’ direct biophysical footprint, capturing how business models depend on or exert pressure on natural systems. This is complemented by the Circularity and Efficiency pillar, which focuses on resource stewardship and firms’ capacity to reduce that pressure over time. Finally, the Outcomes and Controversies pillar provides a backward-looking validity check by accounting for realised biodiversity- and environment-related incidents.
Taken together, this architecture renders trade-offs explicit rather than hiding them. A firm may exhibit strong governance alongside high ecological pressure. Another may have a low current footprint but weak forward-looking commitments. By maintaining these dimensions as analytically distinct, the BNPi avoids collapsing biodiversity performance into an opaque composite where the weaknesses of one dimension are quietly offset by the strengths of another.
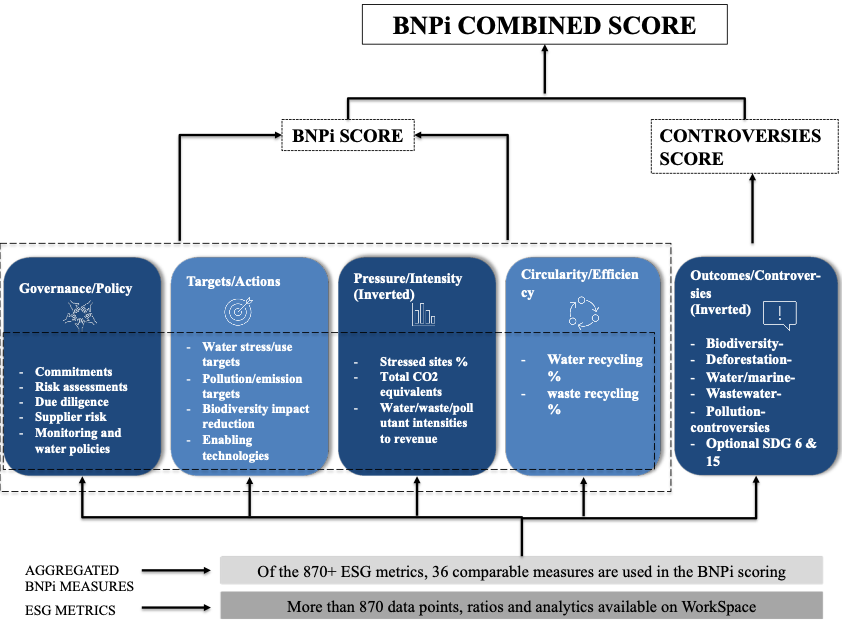
Figure 2: Visualisation of our methodology, with the five-pillar structure of the BNPi. Source: Own creation.
What we found: patterns across Europe
Applying the BNPi framework to more than 2,000 listed companies across the EU-27 and the UK produces several clear and striking insights. First, the index meaningfully differentiates firms. Scores are widely distributed rather than clustered near the mean: biodiversity-related performance is far from uniform, even within the same industry. This is precisely what a useful risk-screening tool should show.
Second, geography matters, though not deterministically. Southern and Western European companies, particularly in Spain, Portugal, and France, tend to score above the European average, while several smaller Eastern and South-Eastern economies lag behind. But high- and low-performing firms exist in nearly every country, suggesting that national context shapes outcomes without fully determining them.
Third, industry structure plays a dominant role. Real-economy sectors with tangible environmental interfaces (energy, materials, utilities, food production) often score higher than finance- and knowledge-intensive sectors. Importantly, this does not necessarily imply superior ecological outcomes; in many cases it reflects stronger governance traditions and more mature reporting practices. This is precisely the kind of nuance a multi-pillar framework makes visible.
Finally, governance and forward-looking targets emerge as the strongest drivers of overall BNPi performance. Firms that score well on these pillars also tend to perform better on pressure, circularity, and outcomes, consistent with the logic embedded in CSRD and TNFD: building the organisational capacity to manage nature risks is a precondition for managing them well.
What this means for investors
The BNPi is not a buy-or-sell signal, nor does it claim to measure true ecological impact. What it does, and what investors urgently need, is to function as a credible screening and risk-identification tool. It helps investors identify where biodiversity-related risks may be concentrated across portfolios, industries, and geographies, and where disclosure gaps may mask underlying exposure.
Interpreting scores requires care. A high BNPi score does not imply nature-positive impact, and a low score does not automatically indicate ecological harm. Coverage matters: firms with limited disclosure may appear stronger than warranted, while transparent firms may expose weaknesses more clearly. These are features of the index, not flaws: they reflect the messy, incomplete reality of today’s biodiversity data landscape. Used thoughtfully, the BNPi supports targeted engagement with portfolio companies, prioritised due diligence on high-risk exposures, and alignment with the rapidly evolving expectations of CSRD, TNFD, and institutional investors increasingly asking hard questions about nature.
About the Authors
Ebbe Barsøe Nielsen is finalizing his MSc in General Management and Analytics at Copenhagen Business School. During his studies, he completed the Minor in Environmental, Social, Governance (ESG): Metrics, Reporting and Sustainable Investments, where he worked extensively with ESG data, regulatory frameworks, and empirical analysis – including the LSEG-based project that forms the foundation of this blog post. Alongside his studies, Ebbe works within Strategy, PMO & Process at Everllence, where he is responsible for a portfolio management and reporting project.
Emil Cramer Monk is finalizing his MSc in General Management and Analytics at Copenhagen Business School. During his studies, he completed the Minor in Environmental, Social, Governance (ESG): Metrics, Reporting and Sustainable Investments, gaining extensive hands-on experience with ESG data, regulatory frameworks, and empirical analysis, including the LSEG-based project that forms the foundation of this blog post. Alongside his studies, Emil works within Strategy, PMO & Process at Everllence, where he supports large-scale programs and strategic initiatives across program governance and stakeholders.
Jonathan Vinther Højgaard is completing his MSc in Business Administration & Economics (General Management and Analytics) at Copenhagen Business School. Like the two others, he pursued the Minor in Environmental, Social and Governance (ESG): Metrics, Reporting and Sustainable Investments. Through the collaboration with LSEG and the use of the WorkSpace platform, he focused on translating complex ESG datasets into structured financial insights, primarily focused on investors – an approach that underpins this blog post. Alongside his studies, Jonathan works in Finance & Controlling at Everllence, where he engages with performance measurement, cost structures, and financial reporting. He has a strong interest in the intersection of finance and sustainability, particularly in how ESG data can inform investment decisions and long-term capital allocation.
Prof. Kristjan Jespersen is an Associate Professor in Sustainable Innovation and Entrepreneurship at the Copenhagen Business School (CBS). Kristjan is an Associate Professor at the Copenhagen Business School (CBS). As a primary area of focus, he studies the growing development and management of Ecosystem Services in developing countries. Within the field, Kristjan focuses his attention on the institutional legitimacy of such initiatives and the overall compensation tools used to ensure compliance. He has a background in International Relations and Economics.